

Metrics
Monitor resource usage and activity for your Sliplane database.
Viewing metrics
Open your database in the Sliplane dashboard and go to the Metrics tab. Each chart is interactive: hover to see the exact value at a point in time, and use the controls in the top-right corner to zoom in, zoom out, or reset the view.
Available metrics
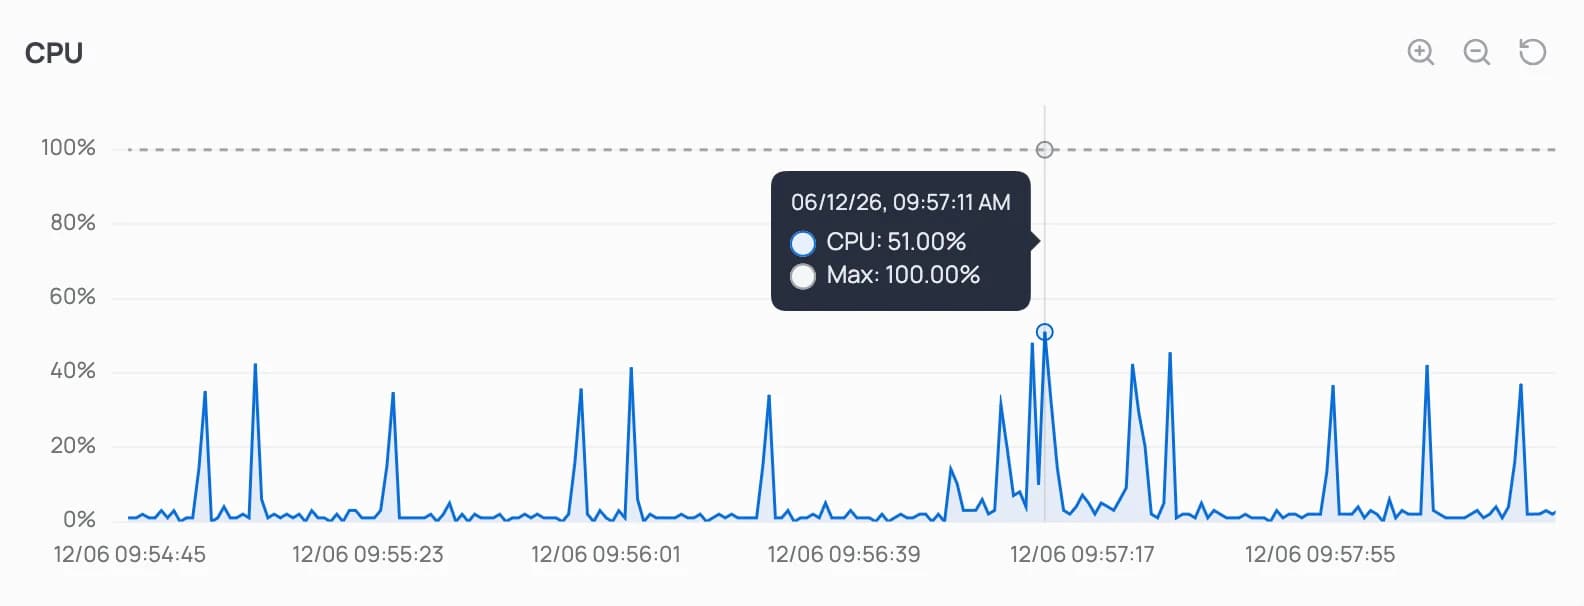
CPU
CPU usage as a percentage of the cores available to your database. Short spikes during queries are normal; sustained high usage is a sign that you should scale up your compute.
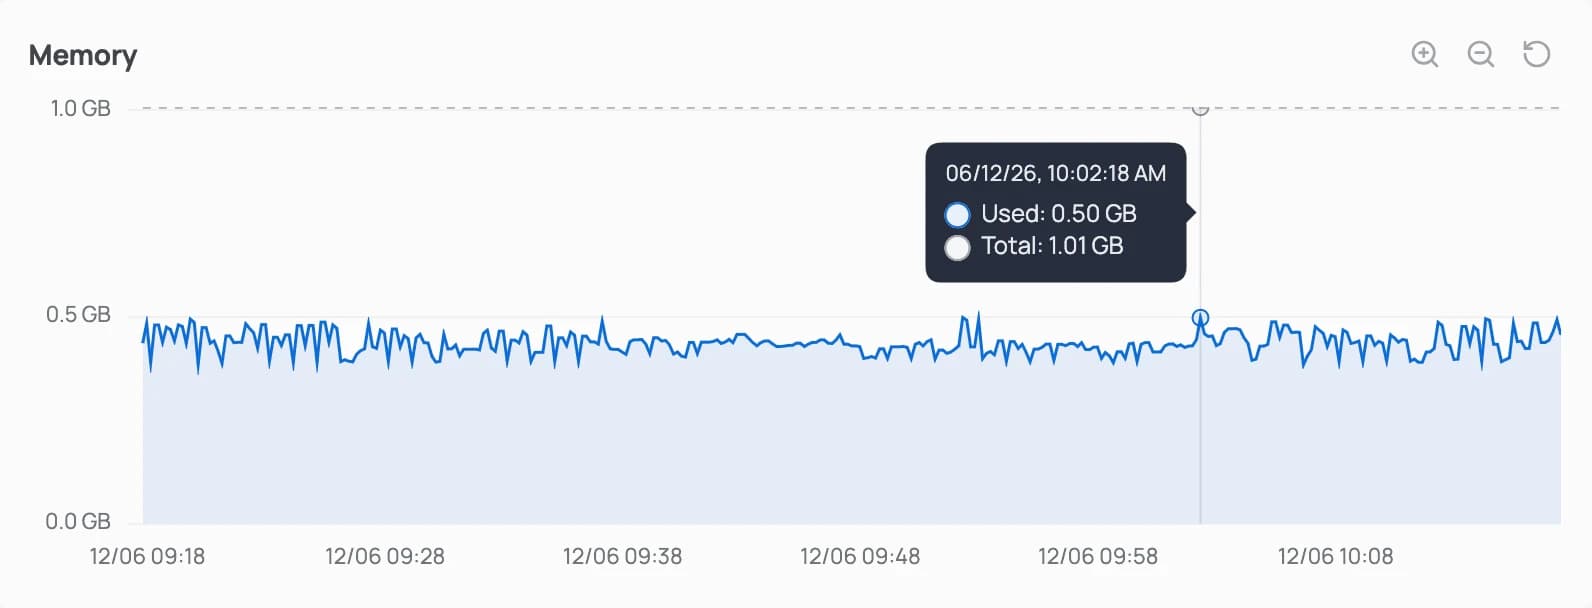
Memory
Memory used by your database against the total memory available. PostgreSQL uses free memory for caching, so some headroom is healthy.
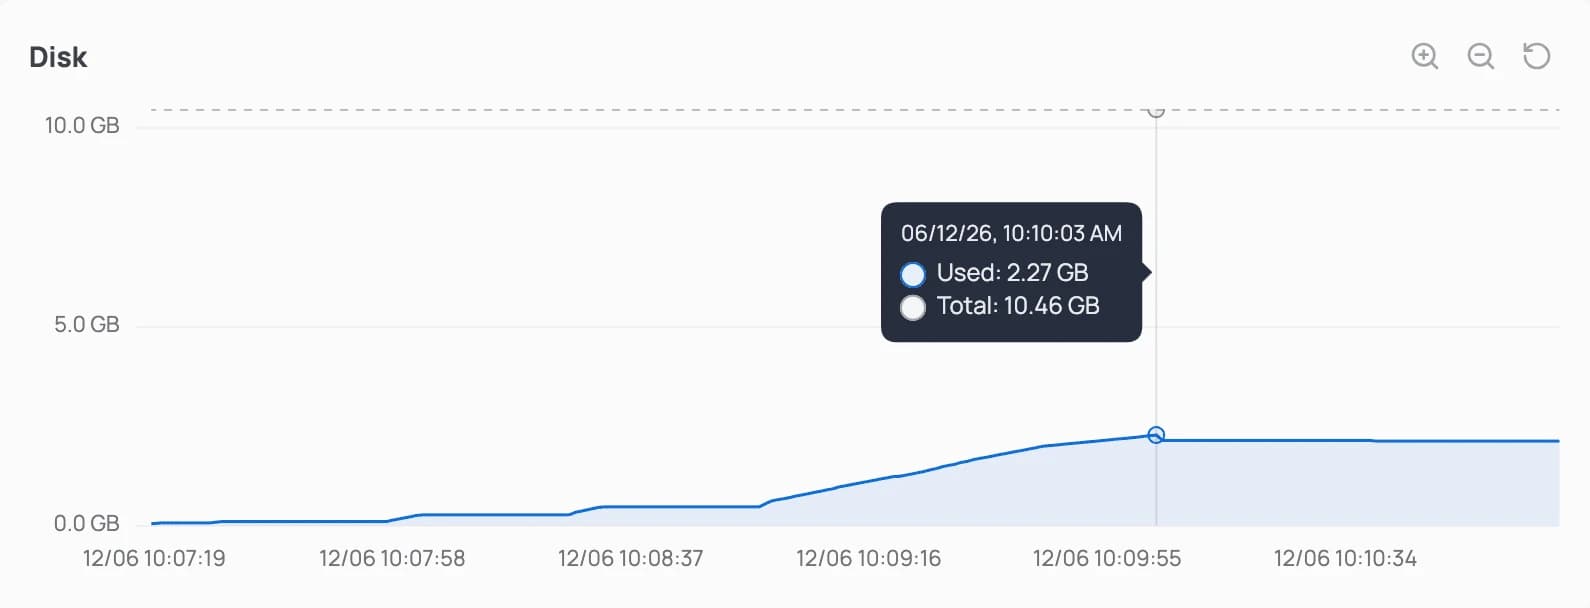
Disk
Disk space used against the total volume size. Watch this metric to decide when to add more storage.
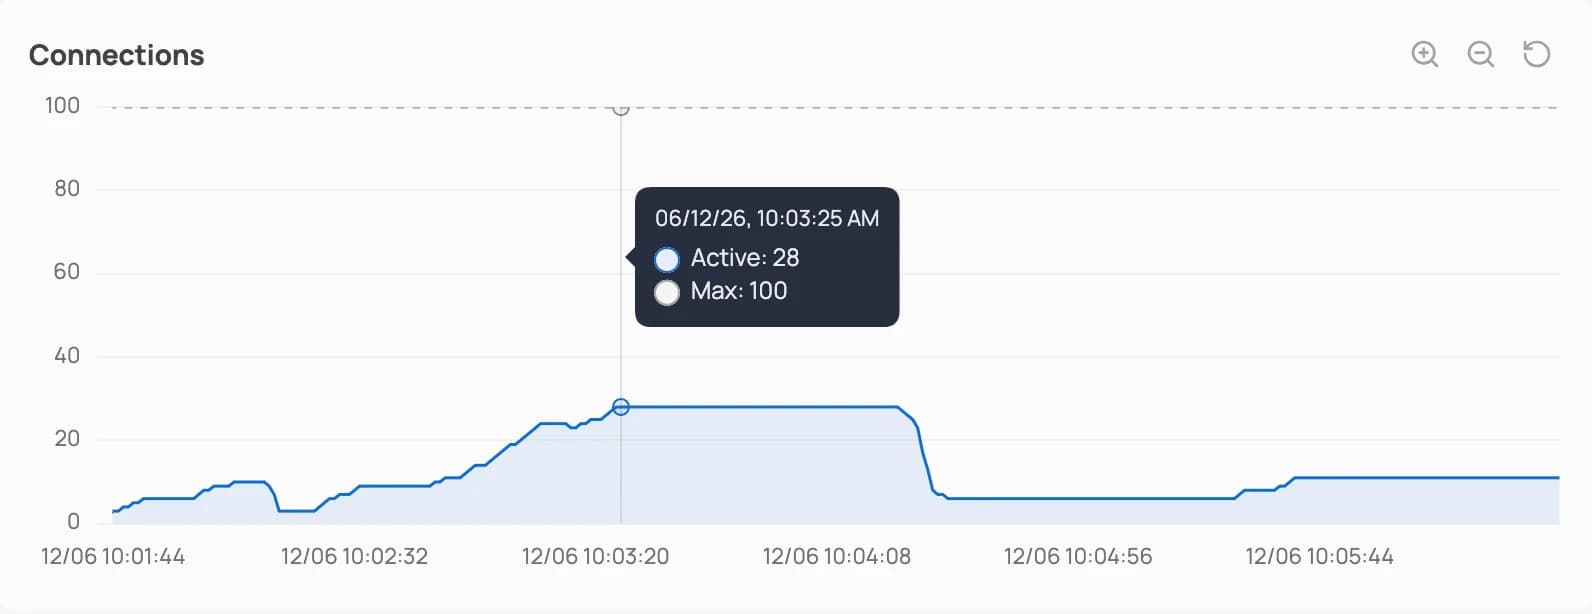
Connections
Active connections compared with your database’s connection limit.
See Upgrade to increase compute or storage.
Query stats
Query statistics help you find slow and frequently run queries so you can optimize your database. Open your database in the Sliplane dashboard and go to the Query Stats tab.
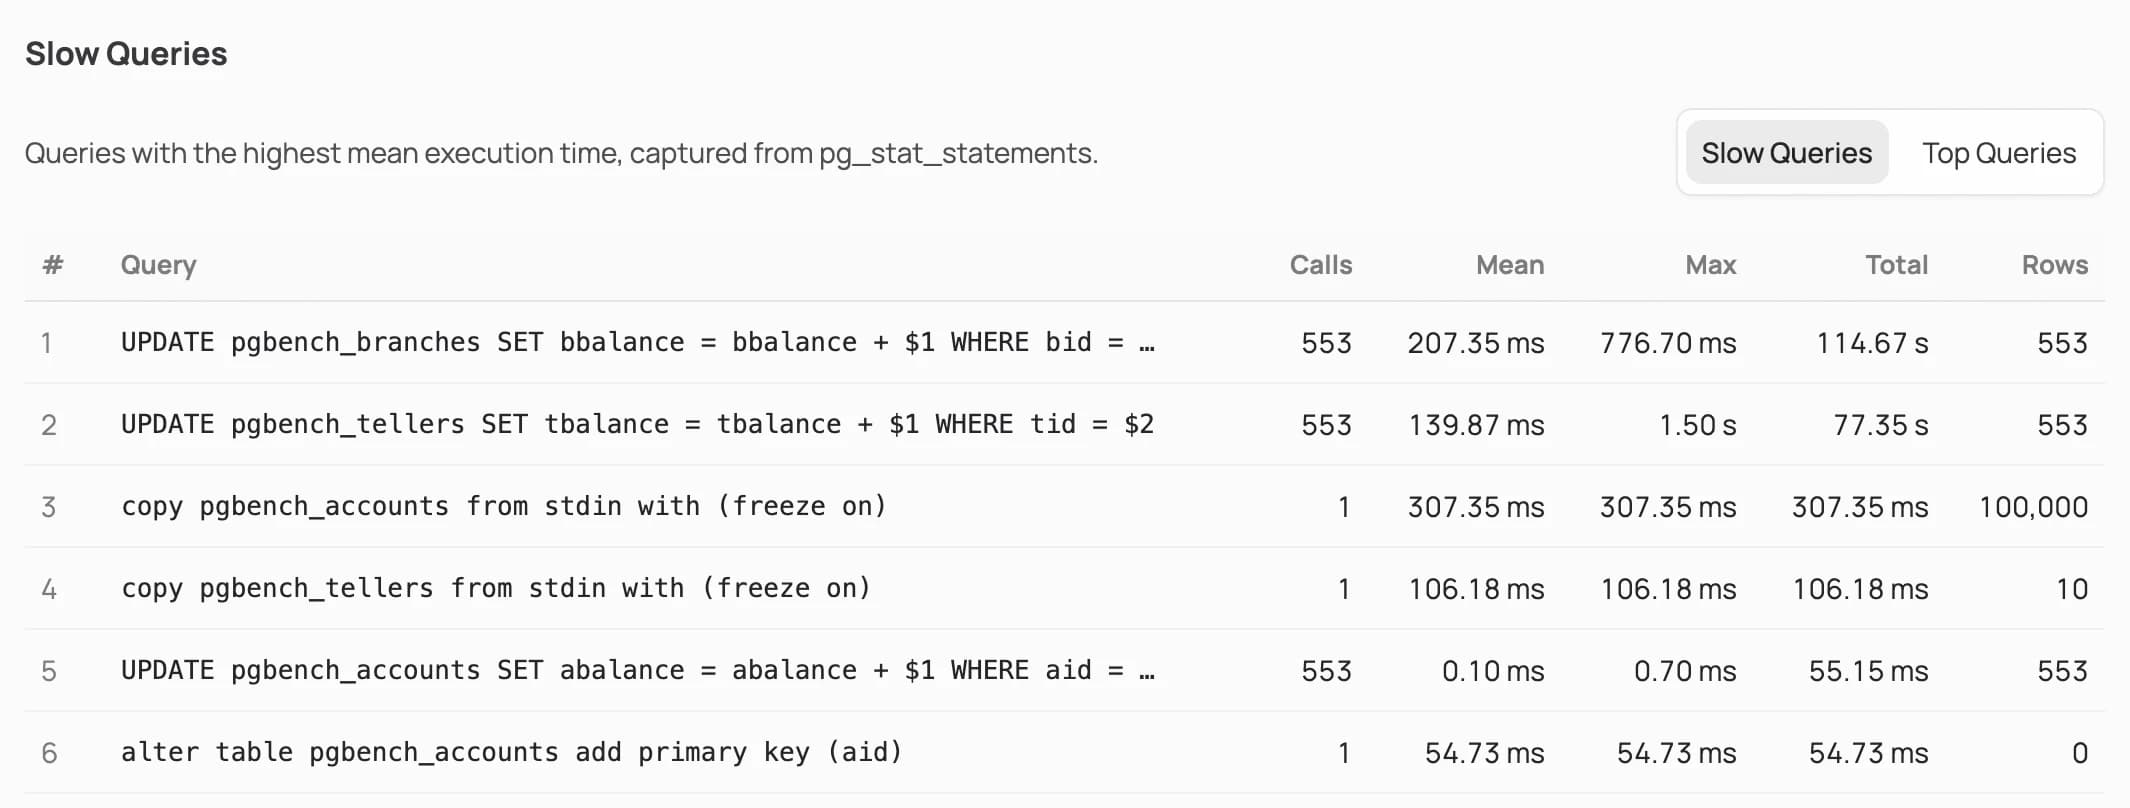
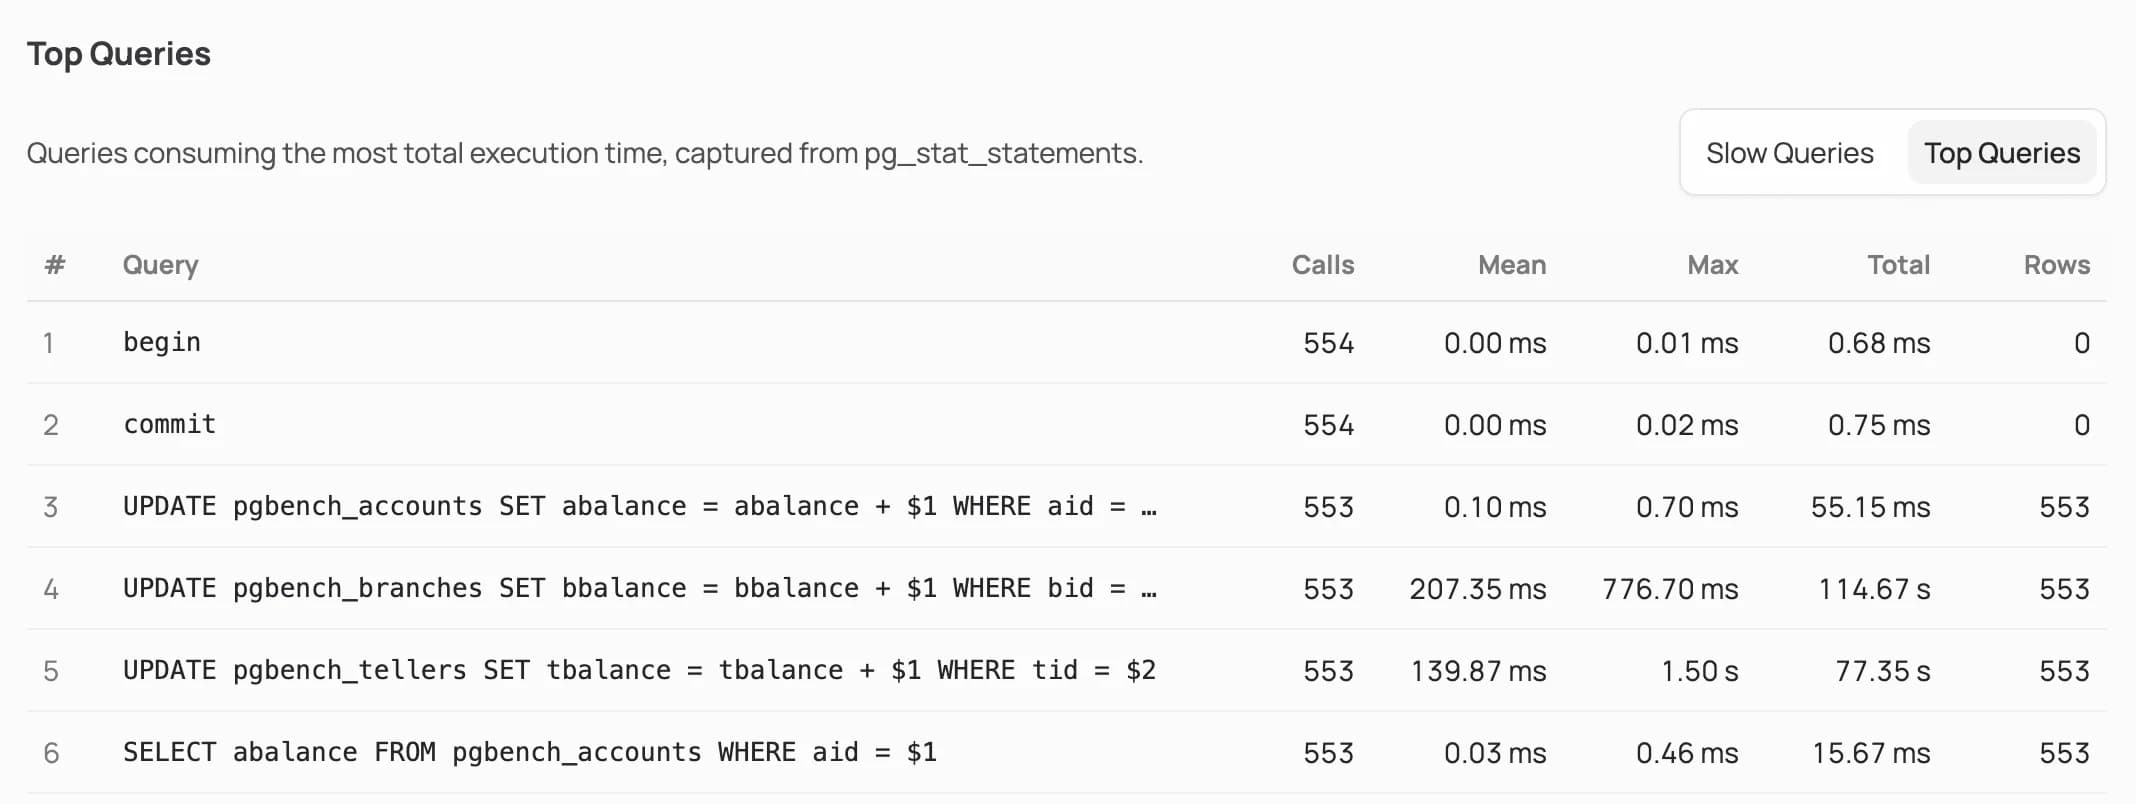
Query statistics are based on PostgreSQL's pg_stat_statements. Each table shows the number of calls, mean and max execution time, total execution time, and rows returned for every query.
Slow queries
Queries with the highest mean execution time.
Top queries
Queries consuming the most total execution time.
How is this guide?